Facts Upon Delivery: What Is Rhetorical About Visualized Models?
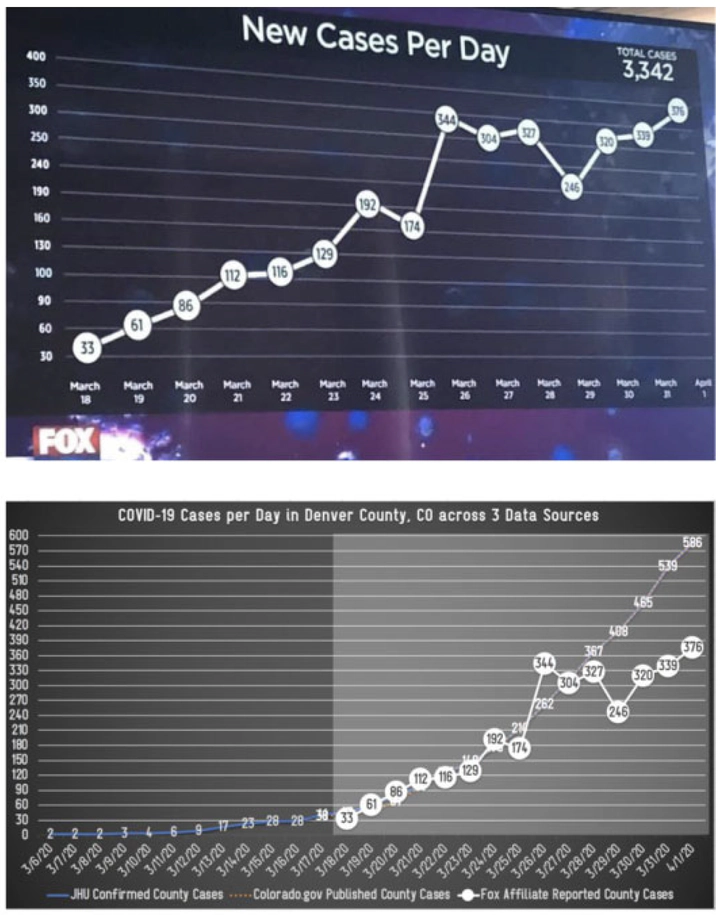 Designers circulate an image of KDVR Fox News affiliate’s chart (top half), which does not clarify its provenance, confirmed context, or skewed y-axis (Obasanjo, 2020). In the bottom chart (bottom half), I contrast KDVR’s reporting timeframe (gray box) against the complete data and variation in case totals.
Abstract
What expectations should professionals and the public place on visuals to communicate the uncertainties of complex phenomena? This article demonstrates how charts during the early months of the COVID-19 pandemic articulated visual arguments yet also required extended communicative support upon their delivery. The author examines one well-circulated chart comparing COVID-19 case trends per country and highlights its rhetoric by contrasting its design decisions with those of other charts and reports created as the pandemic initially unfolded. To help nonexpert audiences, the author suggests that professional communicators and designers incorporate more contextual information about the data and notable design choices.
Type
Publication
In Journal of Business and Technical Communication